In past posts, I’ve talked a lot about Solid State Drives. I’ve mostly discussed about why they are going to be relevant on the server side and the shortest form of the argument is based on extremely hot online transaction processing systems (OLTP). There are potential applications as reliable boot disks in blade servers and other small data applications but I’m focused on high-scale OLTP in this discussion. OLTP applications random I/O bound workloads such as ecommerce systems, airline reservation systems, and any data intensive application that does lots of small reads and writes, usually on a database where future access patterns are unknown. When sizing a server for one of these workloads, the key dimension is the number of small random I/Os per second. You need to add memory to increase the memory hit rate and reduce the number I/Os or you need to add disks to support the application-required I/O rates. The problem with adding memory is that it has linear cost – the last DIMM costs as much as the first DIMM – but only logarithmic value. Because the workloads are random, adding memory only delivers a reduction in I/Os roughly proportional to the square root of the memory size. Cheap memory helps but, even then, the costs add up as does the power consumption as memory is added. Alternatively, you can add disk but each disk added gives only another roughly 200 I/Os per second (IOPS) when using very expensive, 15k RPM disks.
The problem is best summarized by my favorite chart these days from Dave Patterson of Berkeley:
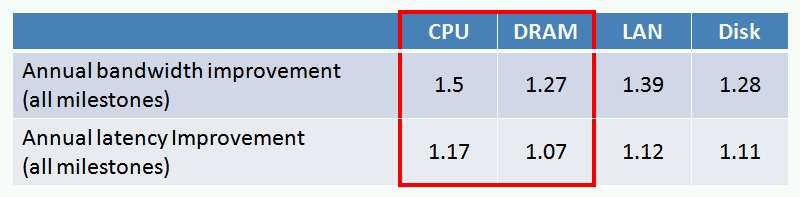
This chart is from an amazingly useful paper, Latency Lags Bandwidth (if you know of no-charge location for this paper, let me know). In this chart, Dave tracks the trend of bandwidth and latency over the last 20+ years. For the purposes of this discussion ignore the latency row and focus on bandwidth. Disk bandwidth is growing slower than DRAM and CPU bandwidth. I love looking for divergent trends in that they direct us to the more fundamental problems needing innovation.
Understanding disk bandwidth growth is a growing problem, let’s compare disk sequential bandwidth with random I/O rates over-time. In the chart below, I graph sequential bandwidth growth against random bandwidth growth over the same period:
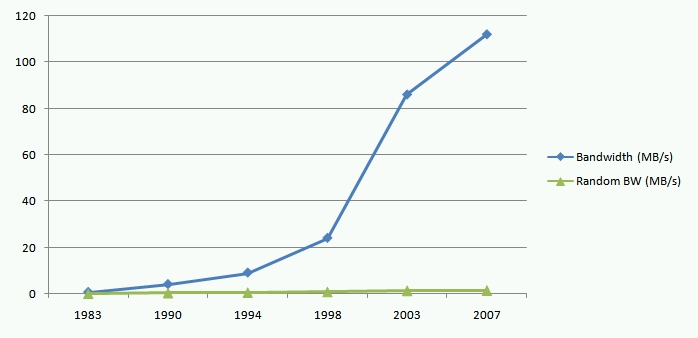
We know that disk sequential bandwidth growth lags the rest of the system. This graph shows that random IOPS bandwidth is growing even more slowly. Across the industry, we have a huge problem and the trend lines above make it crystal clear that the problem won’t be cost-effectively solved by disk alone. More detail on one dimension of the disk limits problem in: Why Disk Speeds aren’t Increasing.
Disks clearly aren’t the full solution. Ever larger memory sub-systems actually are part of the solution but the logarithmic (or worse) payback with linear cost and power consumption makes memory an expensive approach if we use it as the only tool. Many have argued for the last couple of years that solid state disks are the solution to filling the chasm between memory and disk random IOPS rates. Jim Gray was one of the first to make this observation in: Tape is Dead, Disk is Tape, Flash is Disk, Ram Locality is King.
The first generation, server-side SSDs were slow random write performers but we’re now seeing great components released to the market. See 100,000 IOPS and 1,000,000 IOPS. These are great performers but they are far from commodity pricing at this point. Intel has been doing some great work on SSDs and I really like this one: Intel X25-E Extreme SATA Solid-State Drive. It’s a step towards commodity pricing. Overall the industry now has great performing parts available and the price/performance equation is very rapidly improving since this is a semi-conductor component rather than a mechanical one.
When should we expect the crossover? At what price point are SSDs a win over HDDs? Unfortunately, it’s an application specific answer. It depends upon I/O density of the workload, the number of I/Os per GB of data. Bob Fitzgerald has done a great job of analyzing different workloads to understand what level of application I/O heat (IOPS per GB) are needed to justify a SSD. Building on Fitz’s work, I have a quick test you can use to figure out how cheap an SSD will have to get before it is a win in your application.
My observation goes like this. Disks have an abundance of capacity and are short of IOPS so, on random IOPS intensive workloads, the limiting factor using HDDs will be IOPS. SSDs have an abundance of IOPS and are short of capacity, so the limiting factor using SSDs will be capacity. SSDs are cost effective for your application when the cost of the disk farm adequate to support the IOPS you need is more than the SSD farm required to support the capacity you need. As a formula:
current#hdd * hdd$ > CapacityNeeded / Capacity_ssd * ssd$
Let’s try an example. This example application is hosted on several hundred database servers and it’s a red hot transaction processing system. Each system has 53 disks of which 40 are used to store data and 8 for log and a few for admin purposes. Leave the log on magnetic media since disks sequential bandwidth is cheaper than SSD sequential bandwidth. The database size on each server is 572GB. The disks used by this application are 15k RPM, 3 ½ disks that price out at $333 each. Understanding this, the disk budget per server for this application is 40 * 3333 which is $13,320. We know we need 572GB and let’s assume we are trying out 64 GB SSDs. Using that equation, 572/64 is 8.9 so we’ll need 9 SSDs to support this workload.
Taking the disk budget of $13,320 and dividing by the 9 SSDs we have computed we need, we can afford to pay up to $1,480 for each SSD. If the SSDs cost is less than this, it’s worth doing. This model ignores the power savings (SSDS usually run under 1/5 the power of HDDs and fewer are needed) and other factors like service costs but it’s a quick check to see if SSDs are worth considering.
We also need more data on SSD longevity in high write-rate workloads. In the absence of historical data, ask your vendor to stand behind their product with full warrantee in your usage model before jumping in.
Speaking of wear-out rates, for the next posting I’ll investigate client-side MLC NAND-flash wear out rates.
–jrh
James Hamilton, Data Center Futures
Bldg 99/2428, One Microsoft Way, Redmond, Washington, 98052
W:+1(425)703-9972 | C:+1(206)910-4692 | H:+1(206)201-1859 | JamesRH@microsoft.com
H:mvdirona.com | W:research.microsoft.com/~jamesrh | blog:http://perspectives.mvdirona.com